In the previous two articles in this series, we talked about the first two pillars of Knowledge Management: Taxonomy Management and Learning Object Management. Learning objects are opportunities of understanding, connected to a body of knowledge. Taxonomy is necessary in connecting those objects to each other and to learners.
What happens next is the most exciting part! To fully understand the content universe we’ve created, and how learners interact with it, we need to visualize it in a knowledge graph.
What’s a Knowledge Graph?
A knowledge graph is a special type of database that helps users visualize relationships between things. It’s distinct from other types of databases in that
- Rather than storing data in tables, it is meant to store objects (called nodes)
- It stores relationships as data points as well (called edges), and these relationships can have attributes just like nodes
- Often it will have a graphical interface that assists in seeing information that might not be apparent in a spreadsheet alone
In a knowledge graph, we can explore data from different sources without having to worry about complex communication between separate databases. By mapping incoming data into normalized structures (i.e., comparing apples to apples), we can then create and use standard queries to fuel our discoveries and generate predictable reporting.
Popular examples of knowledge graphs include Meta’s entity graph (used for social networks), Google’s knowledge graph (used for search), and Amazon’s product graph (used for product discovery).
Use Cases for Knowledge Graphs
A knowledge graph is useful when you need to quickly visualize data patterns that might not be apparent just from a spreadsheet alone. This may include identifying node clusters (nodes with many similar relationships) as well as isolated nodes (nodes with no relationships).
Why might we want to see this information? If we are evaluating concept coverage for test items, we can quickly see which concepts have too much coverage and which concepts have little to no coverage. We can then create an action plan to reduce redundancies and create new content where necessary.
Additionally, a knowledge graph is useful for identifying the shortest and longest paths between objects, as well as simply discovering unexpected relationships between objects.
Let’s say we track the learner interactions within a learning system, where the knowledge graph captures a learner’s tests they took, articles they read, and resource PDFs they downloaded.
We can then examine learners with the highest performances overall and follow their paths in the system, which can tell us what types of interactions and learning objects to recommend to other learners. Perhaps we find that the most successful learners actually skip a particular quiz, which might mean that quiz is not as effective as it could be.
Conversely, we can look at interaction paths for learners with lower scores to see if there are any learning routes or learning objects that might be undermining their performance.
With the right information in a knowledge graph, we can explore our own data in an intuitive way and provide value to learners and associations alike.
Example: Budgeting Knowledge Graph
We’re now going to consider knowledge graph use cases for a fictional certification on budgeting.
We’ll assume we’ve already created a budgeting taxonomy, a repository of learning objects related to budgeting (including learning content and external resources), and we’ve tagged those learning objects to our taxonomy.
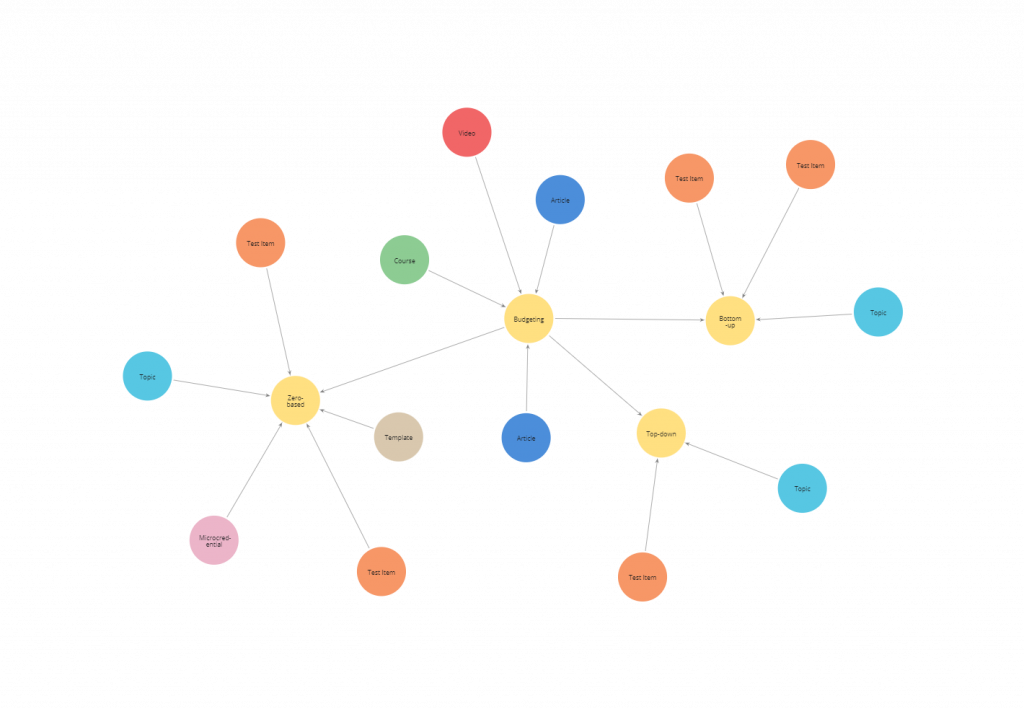
Here’s our full knowledge graph:

We have a main concept, budgeting, which has 3 child concepts: top-down budgeting, bottom-up budgeting, and zero-based budgeting. We also have learning objects like articles, videos, certifications, and micro-credentials.
What if we wanted to see all the learning objects related to zero-based budgeting? We can do that!

We can also see any certifications or micro-credentials that share the same test items related to zero-based budgeting to compare learner performance:

From here, if we want to help learners who don’t perform well on zero-based budgeting, we can recommend articles or topics as a next step. Or if a learner performs well on test items related to zero-based budgeting, perhaps we recommend a micro-credential on zero-based budgeting that we found in our earlier search.
Obviously, this example features a very small knowledge graph—your knowledge graph may contain thousands of nodes and millions of relationships.
But the underlying principles are the same. Knowledge graphing helps us understand the data we’ve painstakingly collected in an intuitive way and helps us provide value to those who need it.
Stay tuned for the final part of our series on Knowledge Management, where we summarize the benefits and use cases of Knowledge Management and how to generate a Knowledge Management plan.
If you don’t have the expertise on staff, but you’re ready to create a Knowledge Management plan, or if you’re curious if this might be a benefit to your Association, HC can help. Reach out to us at [email protected] to get started.


